• This forum is the machine-generated translation of www.cad3d.it/forum1 - the Italian design community. Several terms are not translated correctly.

standardized data [statistics]

  • Thread starter Thread starter reye
  • Start date Start date

reye

Guest
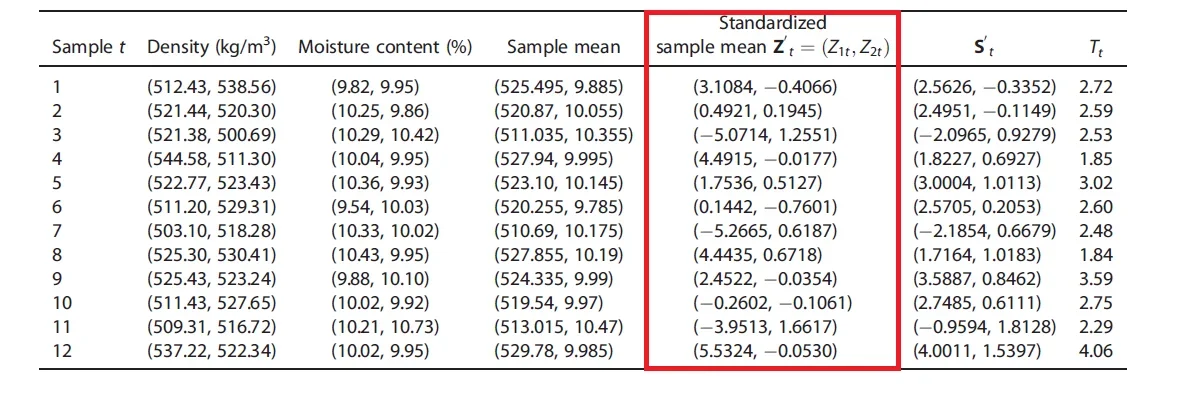
hello to all, in the attached file are reported data related to two production variables.
standardization shows the data indicated with z=(z1t,z2t), obtained with average values 520 (variable 1) and 10 (variable 2) and standard deviation 2.5 (variable 1) and 0.4 (variable 2). I have 12 size samples 2. making calculations on standardized data is a different average from zero and a standard deviation different from 1, which contrasts with what is reported on standardization theory. Can someone help me clarify this situation?
 

Attachments

  • Immagine.webp
    Immagine.webp
    84 KB · Views: 18
which means standardized? You mean normalized?
from how you put the question you do not understand if you want to know why the process is out of control, or why you do not find yourself with the accounts, and then you do not say how the accounts are made.
take into account that if you normalize a process not to normal distribution, the residual can move both the average, and variance.

first see if in the original distribution fashion coincides with the average. If that's not how the analysis ends there. use fashion and weibull residues instead of average and variance and see that you find more credible numbers.
exactly, I mean by standardization the transformation into random variable with media=0 and standard deviation=1.
considered m=12 samples, the formula used is z=(x-m)/s, where x indicates the average of each sample m, m is the average of m samples, s the standard sample deviation. for calculation I must necessarily use media and variance
 
too unusual argument? no one who can say his about it? on standardized averages (indicated with zt in the image attached in the first message) the matrix of covariance is (data from the book)

0.28 0.042
0.042 0.130,

but with the formulas used I do not find these results. Can anyone check if it matches?

another doubt is the following: the standardization reported in the image, obtained after giving the two variables the averages 520 and 10 and the standard deviations 2.5 and 0.4 (as required by the text), does not lead to media=0 and standard deviation=1. .
 
the average, for each variable, is 521.16 and 10.08, but the calculation of standardized data must take place with 520 and 10. as far as fashion is concerned, I can only calculate more frequency intervals
 
Maybe I'm stupid or detained, but I can't figure out what you're saying. you say "the average is 521.16, but it must be 520". the average is not that "must be", given a distribution of data, the average "is".
You should explain better:
- from which data parts. I see twelve samples there, which are so few that normalization will certainly come with important residues.
- for each variable I see a pair of values. Is it vector size?
- How do you do normalization? calculate the average and remove it from values, or use other methods?

If I take the first column I get the average 520.47 and fashion 521, I would say they are quite close, so it is possible that it is a normal distribution, but why the numbers that come to you are different?

You have to explain in detail your problem and your solution, if you take too many things for granted, it is difficult to understand what is going on. I don't even know what the problem is. You want to impose a different average than the one that comes from the calculations, don't complain if you don't find yourself with the calculations.
 
I will try to be as clear as possible and apologize if I have given many concepts and procedures for discount: in the attached image I have twelve samples, size equal to 2, referring to two variables.
starting from this data, I must standardize them: from what I learned, "standardize" means getting a random variable with zero average and standard deviation of 1. That said, a scientific article in my possession requires standardizing according to the averages 520 (for the 1st variable) and 10 (for the second variable) and the standard deviations 2.5 (1st variable) and 0.4 (2nd variable). I get the following standard data:

(1a var) (2a var)
3.1084 -0.4066
0.4921 0.1945
-5.0714 1.2551
4.4915 -0.0177
1.7536 0.5127
0.1442 -0.7601
-5.2665 0.6187
4.4435 0.6718
2.4522 -0.0354
-0.2602 -0.1061
-3.9513 1.6617
5.5324 -0.0530

Before asking other questions, I ask: is it normal that these data have averages different from 0 and standard deviations different from 1, as required by standardized normal distribution? Once again the standardization took place with the data provided by the said article.
 
with twelve (pochissimi!) samples it is normal to have an average different from 0 and a variance different from 1. for the law of large numbers more are the samples and more average and variance approach the theoretical ones. what I can't understand is:
That said, a scientific article in my possession requires standardizing according to the averages 520 (for the 1st variable) and 10 (for the second variable) and the standard deviations 2.5 (1st variable) and 0.4 (2nd variable).
What do you mean, "hot"? Where does 520 come from? could:
1. be the "real" media, while those twelve samples are just some of the ones available
2. be the average of control samples, while those twelve are verification samples (but here we enter a more complicated field)
3. (very likely) is the starting date.

Case 3 could be the case when I made twelve pieces 520mm long and then measured the dispersion of the measurements. In this case I do not have the "average" 520, but the "desired average" of 520. It is obvious that with only twelve samples the real average does not coincide with the theoretical one. You could have two thousand samples, and... what's going on? approach 520 if you have a normal distribution.

Now I have hypothesized a plausible scenario, but the text says what is that 520?
 
Well, you see how slowly the truth comes out with the panties?

Do you have a process to control, use control cards? What kind? Do you work on a mobile media 12 steps away? Those numbers are telling you that you have a process under control (the variance is close to 1) but out of regulation (the average will become from scratch).

control cards, however, must have limit bands, you cannot expect exactly 0 and 1.
 
the control card is a multivariata cusum.
My problems concern the calculation of the matrix of covariance of the vector of the sample averages and the standardized averages.
I operate in this way: for example, for the first sample (field size n=2) you have

512,43 and 538,56, from which sample averages 525.5 and variance equal to (512,43-525,5)^2 + (538,56-525,50)^2)/(n-1)=341,39, and so on for all others. high the sample variances obtained and divided by the number of samples (12), thus obtaining a variance of 139,54, i.e. standard deviation of 11,81.
However the variance of the first variable for the carrier of the sample averages is indicated (see attached text) of 6,25, so far from the above calculations. Where am I wrong?
 

Attachments

  • Immagine.webp
    Immagine.webp
    74.6 KB · Views: 7
Covariance matrices are known regardless, they are assigned by the project. for anyone who wants to quote the calculations on the 12 samples will not lead to the attached data, but only because, I repeat, they are assigned and not calculated;)
 

Forum statistics

Threads
44,997
Messages
339,767
Members
4
Latest member
ibt

Members online

No members online now.
Back
Top